メインコンテンツまでスキップ

CassandraデータベースによるStorageGRIDのCPU利用率が高いと、S3クライアントのレイテンシが増加します

Views:
1
Visibility:
Public
Votes:
0
Category:
storagegrid<a>2009523687</a>
Specialty:
sgrid
Last Updated:

環境

  • NetApp StorageGRID
  • ソフトウェアリリース11.6以降のバージョン

問題

  1. 以下に示す指標はすべて、StorageGRIDのグリッドマネージャの [Support] > [Metrics]で確認できます。
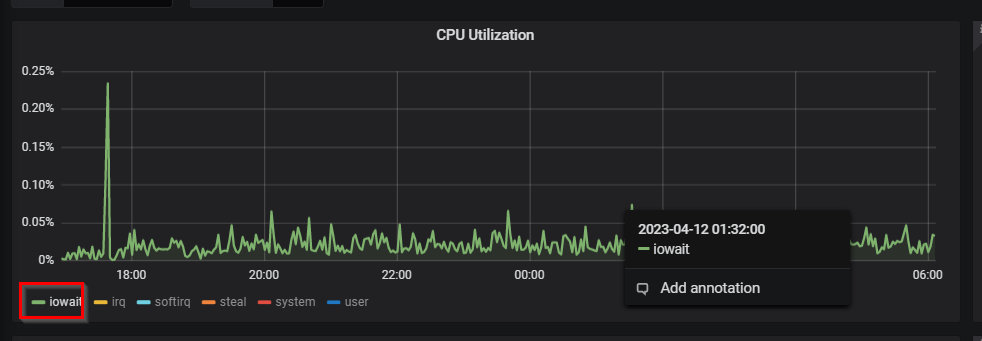
  2. ストレージノードでは、CassandraのCPU利用率が85%を超え、 I/O 待機時間が最小限に抑えられています。これは 、Node(Internal Use) Grafanaダッシュボードにあります。

大量のCassandraタスク保留中のタスクキューが大きすぎます。CPU利用率(サービス別)。png

大量のCassandraタスク保留中のタスクキューが大きすぎますCPU Utilization.png

  1. Cassandra ReadStageは一貫して最大レベルに達しています。これは  、Cassandra Node OverviewGrafanaダッシュボードで確認できます。
大量のCassandraタスク保留中のタスクキューが大きすぎるKBスレッドプールアクティブTasks.png
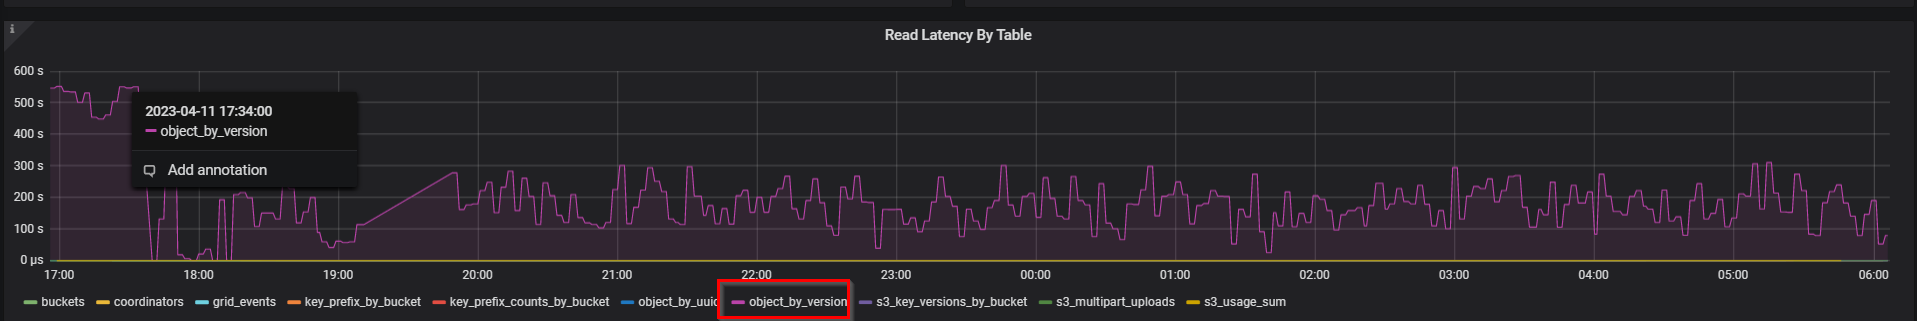
  1. 1つのCassandraテーブルでは、数百秒という非常に高いレイテンシが示されています。これは 、Cassandra Node Overview Grafanaダッシュボードで確認できます。
    1. 次の例は、このような高レイテンシのOBJECT_BY_VERSIONを示しています。 任意のテーブルである可能性があることに注意してください。

Table.pngによる大量のCassandraタスク保留タスクキューが大きすぎます。KB読み取りレイテンシが大きすぎます

  1. 次のコマンドは、ノードのCassandraディレクトリに100を超えるエントリを返します。ローテーションされたログファイル(つまり jstack.log.1)を確認することを検討してください。 

# cd /var/local/log/cassandra/jstack/
# grep -c Murmur3 jstack.log
8393

Sign in to view the entire content of this KB article.

New to NetApp?

Learn more about our award-winning Support

NetApp provides no representations or warranties regarding the accuracy or reliability or serviceability of any information or recommendations provided in this publication or with respect to any results that may be obtained by the use of the information or observance of any recommendations provided herein. The information in this document is distributed AS IS and the use of this information or the implementation of any recommendations or techniques herein is a customer's responsibility and depends on the customer's ability to evaluate and integrate them into the customer's operational environment. This document and the information contained herein may be used solely in connection with the NetApp products discussed in this document.